
Unpacking the Top Trends of Grant County's Year-End Market.
- Kim Clark

- Dec 18, 2023
- 3 min read
December 18, 2023 - By, Kim Clark, Association Executive
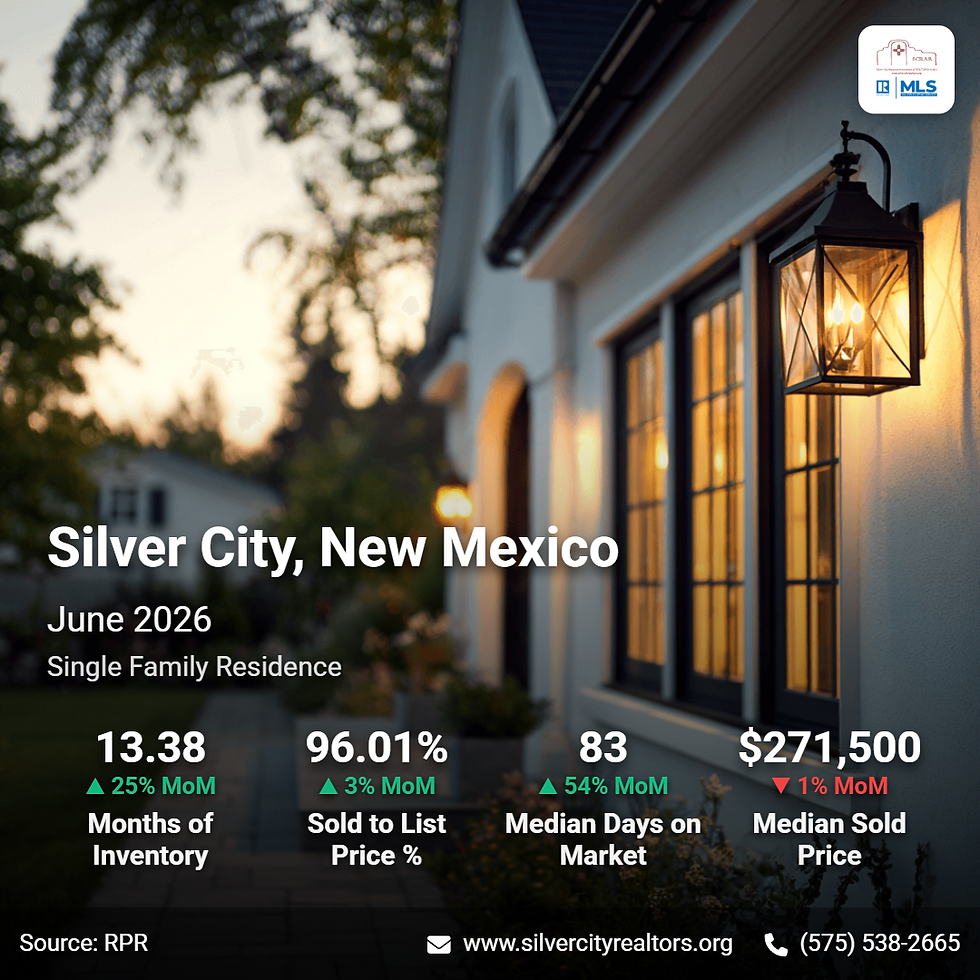
In the world of real estate, there are several important metrics that both buyers and sellers should be aware of. These metrics provide valuable insights into the current state of the market and can help guide decision-making processes. Today, we will be discussing key metrics for Grant County, New Mexico:

Months Supply of Inventory,
12-Month Change in Months of Inventory,
Median Days Homes are On the Market,
List to Sold Price Percentage
Median Sold Price.
Let's start with the Months Supply of Inventory, which currently stands at 4.54. This metric represents the number of months it would take for the current inventory of homes on the market to be sold out, given the current sales pace. A lower number indicates a seller's market, where demand exceeds supply, resulting in potentially higher prices and quicker sales. Conversely, a higher number suggests a buyer's market, with more supply than demand, which could lead to more negotiation power for buyers and potentially lower prices.
The 12-Month Change in Months of Inventory is an essential indicator of market trends. Currently, this metric has experienced a positive change of 18.85%. This means that over the past year, the number of months it would take to sell the current inventory has increased by approximately 18.85%. This change could indicate a shift towards a more buyer-friendly market, as the supply of homes has increased relative to the demand.
Moving on, the Median Days Homes are On the Market is 40. This metric represents the average number of days it takes for a home to sell from the moment it is listed. A lower number suggests a faster-paced market, where homes are selling quickly. A higher number indicates a slower market, where it may take longer for homes to sell. As a buyer, this metric can help you understand how quickly you need to act when you find a home you're interested in. As a seller, it can give you an idea of how long you might expect your home to be on the market before finding a buyer.
The List to Sold Price Percentage is another metric that can be important for both buyers and sellers. Currently, this percentage stands at 93.9%. This means that, on average, homes are selling for 93.9% of their list price. As a buyer, this can help you gauge the level of negotiation power you may have when making an offer. As a seller, it can give you an idea of the potential difference between your list price and the final sale price.
Finally, we have the Median Sold Price, which currently sits at $191,500. This metric represents the middle point of all the home sale prices in a given area. It provides a general idea of the market's price range, allowing both buyers and sellers to understand the average price at which homes are selling. As a buyer, this can help you determine if the market aligns with your budget. As a seller, it can guide you in setting a competitive and realistic asking price.
These real estate metrics provide valuable insights into the current market conditions and can assist buyers and sellers in making informed decisions. By understanding the correlation between these metrics, you can navigate the real estate market more confidently. Whether you're looking to buy or sell, it's always important to stay informed and aware of these key metrics to ensure a successful real estate experience.
To find out more about the home-buying process, give your neighborhood REALTOR® a call right now.


Comments